Automatic
Segmentation of the Sphenoid Sinus in CT-scans Volume with DeepMedics 3D CNN
Architecture
Type of
article: Original
Kamal Souadih1, Ahror Belaid1,
and Douraied Ben Salem2
1 Medical
Computing Laboratory (LIMED), University of Abderrahmane
Mira,06000, Bejaia, Algeria
2 INSERM UMR
1101,Laboratory of Medical Information Processing (LaTIM),
5 avenue Foch, 29200 Brest, France,
Neuroradiology and Forensic Imaging Department,
CHRU Brest, La Cavale Blanche Hospital. Boulevard Tanguy Prigent, 29609 Brest,
France.
Abstract.
Today, researchers are increasingly using
manual, semi-automatic, and automatic segmentation techniques to delimit or
extract organs from medical images. Deep learning algorithms are increasingly
being used in the area of medical imaging analysis. In comparison to
traditional methods, these algorithms are more efficient to obtain compact
information, which considerably enhances the quality of medical image analysis
system. In this paper, we present a new method to fully automatic segmentation
of the sphenoid sinus using a 3D (convolutional neural network). The scarcity
of medical data initially forced us through this study to use a 3D CNN model
learned on a small data set. To make our method fully automatic, preprocessing
and post processing are automated with extraction techniques and mathematical
morphologies. The proposed tool is compared to a semi-automatic method and
manual deductions performed by a specialist. Preliminary results from CT
volumes appear very promising.
Keywords: Deep
Learning, Biomedical Engineering,3D Imaging ,3D CNN, CT scan, Sphenoid Sinus,
Automatic Segmentation.
Corresponding author: Kamel Souadih,Medical Computing Laboratory ( LIMED),Universityof
Abderrahmane Mira ,Bejaia,Algeria .Email:skamelmail@gmail.com
Received: 23
February, 2018, Accepted: 08 Mars, 2019, English editing: 25 Mars, 2019,
Published: 01 April, 2019.
Screened by
iThenticate. ©2017-2019 KNOWLEDGE KINGDOM PUBLISHING.
The
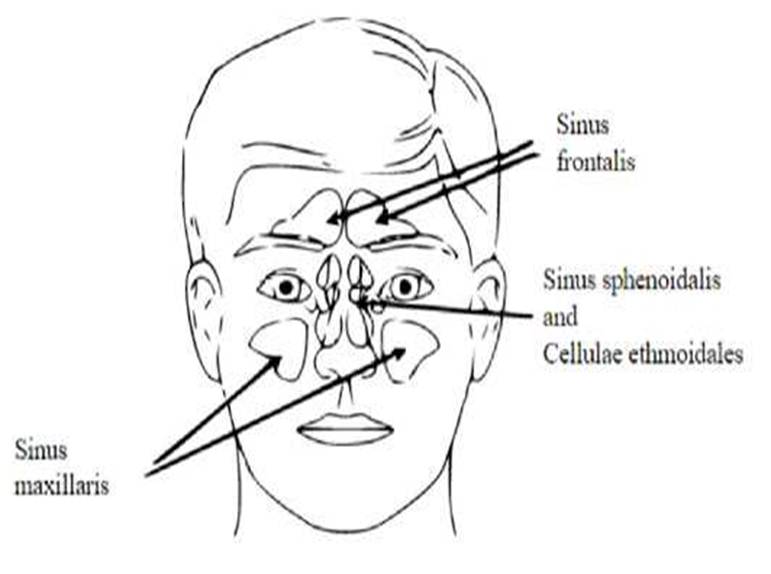
sinuses anatomy are complex and very variable [1]. The sphenoid sinus cavity is
the most variable from person to others. It is an essential landmark in surgery
but it is hard to isolate [2-3-4]. Fig. 1 shows a diagrammatic representation
of the sinuses location. Another difficulty is that the sinuses can also to
divide into multiple niches that communicate the one with the other through an
incomplete bone wall, which further complicates their location [5].
Complexities of spheroidal sinus surgery are easy to avoid if we understand its
anatomical features [6]. Sphenoid bone has a deep anatomical location in the
skull making it difficult to approach. This deep location may be advantageous
in the case of forensic identification. Unlike other sinuses, the sphenoid
sinus is well preserved from traumatic damage of external causes. Sphenoid
sinuses can be classified into four types [7]:
Conchal:
complete missing or minimal sphenoid sinus;
Pre-sellar: the posterior wall of sphenoid sinus is in front of the anterior
wall of the sella turcica
Sellar:
the posterior wall of the sphenoid sinus is between the anterior and posterior
walls of sella turcica
Post-sellar:
the posterior wall of sphenoid sinus is behind the posterior wall of the sella
turcica
|
Fig. 1. Diagrammatic representation of paranasal sinuses. |
This
classification is based on basic aspects (height, width and depth) and can be
used to predict the potential for accidental injury, but they are also useful
for individual identification as can be seen in [8].
CT
scans images are an excellent choice for assessing the anatomy of the sinus
because they provide an accurate craniofacial assessment of the bones and the
extent of their pneumaization [9-4]. By segmenting 3D CT-images of the sphenoid
sinus, we can make useful measurements of its volume anatomy [10, 19, 20].
Image volume segmentation is a technique of marking each voxel in an image and
assigning it to a group of voxels defining an anatomical structure. This
technique has wide and varied applications in medical research and
computer-assisted diagnosis. It makes it possible to extract and recognize
organs. It is used too to improve the visualization and permit quantitative
measurements. Segmentation is essential too for the construction of anatomical
atlases, the search for organ structure shapes and monitoring their evolution
through the age [11]. Artificial Intelligence techniques relying on machine
learning, more and more, are used for the analysis and segmentation of medical
images. In the last years, the appearance of deep learning techniques has
contributed significantly improving medical image analysis, in which
convolutional neural networks (CNNs) are used and that give the ability to
learn significant patterns automatically and extract real structures from
images [3, 12]. One of the keys to the success of the CNN is that it is
possible to use the preformed models directly to perform tasks other than those
initially planned. It is now easy to download a learned model and then adjust
it slightly to adapt it to the application in question [13]. In this work, we
are proposing a new method for the automatic segmentation of the sphenoid sinus
represented on CT scan volumes using a 3D CNN architecture. The proposed method
is robust, fast, and efficient.
2. Material and method
Our
automatic sphenoid sinus segmentation method consists of three main steps,
where the result of the step is the input of another one. The first step is a preprocessing
step; we create and transform automatically the images volume given from a PACS
to an image of the region of interest. Then, we perform a segmentation with 3D
Deep CNN [14] that we adapted and parameterized to produce highly accurate
sinus segmentation. Finally, postprocessing based on mathematical morphology
operations to perform a sinus measurement and refine a segmentation (Figure.1).
This splitting in stages allowed us to improve and simplify the use of CNN at
the CPU level. In the following we describe the method stages:
2.1 The
automatic ROI extraction for the CT-image
The
preprocessing step uses some interesting techniques with slight transformations
that are adapted to improve the effectiveness of the specific type of
segmentation method used in the next step. These transformations are made so
those common parameters can be used for all images of all intensity ranges. In
other words, we aim to operate only on a reduced 3D region, a region of
interest centered on the sinus at issue and not on the whole image. This region
of interest must be the same in terms of dimensions for all images in the data
set of training or test. To achieve this, first a target image with a
well-oriented head and a clear sinus was chosen. We manually traced a large
rectangle, enough to contain the sinus whatever its shape, size does not exceed
200 200 200 pixels. This rectangle will also serve as a reference bounding-box.
Then, all other database images are registered onto this target image with its
bounding box. As the images are coming from different persons, we choose to use
a rigid registration, allowing correction of the different positions and
orientations arising from the clinical exam. Since the natural size of the
skulls is different from one person to another, we have avoided using affine
registration [15], which risks distorting the estimation volume that will be
used later as a parameter for identification. Thereby, we were able to build a
new database consisting only of regions of interest, with the same size as the
reference box.
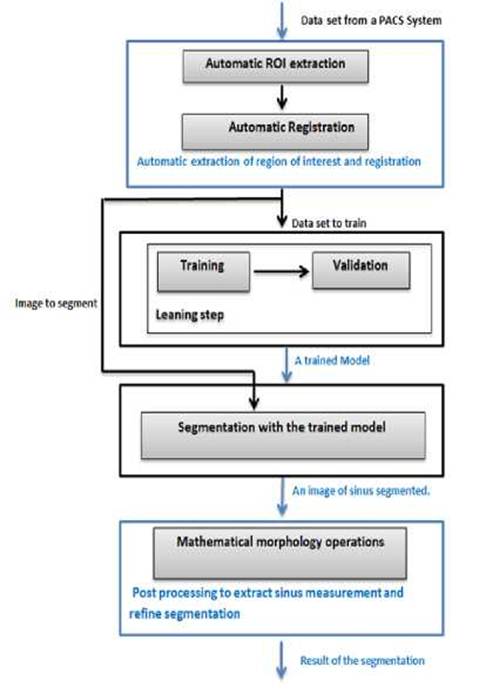
Fig.
2. Flow
chart of the sphenoid sinus segmentation scheme.
2.2 Sinus Segmentation with deep 3D CNNs
This step employs the Deep Medic [16] architecture
realized as open source ar-chitecture for medical images analysis [17], it is
an algorithm with an adjustable number of deep layers, double-pathway and 3D
CNN, created to segment the volume images brain lesions [14]. This architecture
segments MRI 3D images corresponding to a multi-modal 3D patch at multiple
scales. In our study we have used the lightweight version CPU-based of this
software to drive our sinus automatic segmentation model; in our case, we use
one modality and a CT images format. This CPU model gives a satisfactory
solution to our problem. The reliability of this algorithm was evaluated when
fewer training data were available or filters were used, and this architecture
was referenced on the BRATS 2016 Challenge, where it performed exceptionally
well despite the simplicity of the pipeline [17]. It was demonstrated that it
is possible to train this 3D CNN on a small dataset of 28 volume CT scan
images. This network delivered a good result on the task of segmenting ischemic
stroke lesions, accomplishing a mean Dice of 64% (and 66% after
post-processing) on the ISLES 2015 training dataset, ranking among the top
entries [14]. This architecture [16] is based on:
—
Two paralleled convolution paths that process inputs at multiple scales to
provide a large receiver field for final classification while limiting
calculation costs.
—
A small convolutional kernel. That gives efficiency to construct CNNs at depth
without significantly increasing the number of parameters that can be driven
and inspired by the Very deep convolutional networks (VGG) [18]. Designed
efficient and productive 3D CNNs thanks to the much smaller calculation
required for convolution with small 33kernels.
—
A complete convolutional method on image segments in the formation and test
phase.
The
main algorithm steps, which make up this architecture, are presented in this
section. The DeepMedic theoretical background is detailed very clearly in [14].
A summary of each step, which makes up this algorithm follows:
1-
Each layer l ∈
[1, L] consists of Cl Feature Maps (FM) also referred to as
Channels.
2-
Every FM represents a group of neurons that detect a particular pattern (a
feature, in the channels of the previous layer).
3-
A pattern is defined by kernel weights associated with the FM
4-
If the neurons of the m t h FM in the l t h layer are arranged in a 3D grid,
their activations constitute the image defined by
![]()
Where
y l m is the result of convolving each of the previous
layer channels with a 3D kernel, klm .
n is a kernel
adding a learned bias blm applying to a non-linear function f, y0n is the input to the first layer, corresponding to
the channels of the original input image.
5- Each kernel is a matrix of learned hidden weights Wim,n.
6- Each class of segments has a number C l .
7- The activations of C l are fed
into a position-wise softmax function that produces the predicted posterior
with y L c is the activation of the FM at position l G N3 8- The size of the neighborhood of voxels ϕl in the input that influences the activation of a neuron is a receptive field, increases at each
subsequent layer and is given by the 3D vector:
![]()
where
—
kl, and ![]() are vectors expressing the size of the kernels
and stride of the receptive field at layer l;
are vectors expressing the size of the kernels
and stride of the receptive field at layer l;
—
![]() =
(1,1,1) is given by the product of the strides of kernels in layers preceding
in this system;
=
(1,1,1) is given by the product of the strides of kernels in layers preceding
in this system;
—
ϕCNN = ϕL is the CNN receptive field; where the receptive field of a neuron in
the classification layer corresponds to the image patch that influences the
prediction for its central voxel.
9-
The dimensions of the FMs in layer l is given by
10-If an input of size
δin is provided, δin = ϕCNN is a size of input patch
in the common patch-wise. The FMs of
this classification layer have 13.
11-CNNs are trained
patch-by-patch, and random patches of size ϕCNN are extracted from the training images.
12-To maximize the
log-likelihood of the data or, equally, minimize the cross-entropy via the cost function
where
B
is the size of batch, which is then processed by the network for one training
iteration of Stochastic Gradient Descent (SGD);
The pair (Ii, Ci),
∀i ∈ [1,B] is the i th patch in the batch
and the true label of its central voxel;
The scalar p Ci
is the predicted posterior for Class Ci; and
Regularization terms were
omitted for simplicity. Multiple C i Sequential optimization steps
over different batches gradually lead to convergence.
13-The classification layer
is the activation of the last layer of CNN.
14-Memory requirements and computing
times increase with the batch size, which is the limitation of 3D CNNs,
DeepMedic uses a strategy that exploits the dense inference technique on image
segments. Following from Eq.(2), if an image segment of size greater than ϕCNN is given as input to
the network, the output is a posterior probability for multiple voxels ![]() . If the
training batches i={x,y,z} are formed of B segments extracted from the training
images, the cost function Eq.(3), in the case of dense-training[14] becomes
. If the
training batches i={x,y,z} are formed of B segments extracted from the training
images, the cost function Eq.(3), in the case of dense-training[14] becomes
![]() (6)
(6)
where Is, and Cs are the s-th segment of the batch
and the true labels of its v-th voxel, x v the corresponding position in the classification
FMs and pcv the output of the softmax function. Factor V
increases the effective lot size without the corresponding increase in
calculation and memory requirements DeepMedic
architecture is also a deep architecture based on small 33 kernels that are
faster to convolve with and contain fewer weights [14].

Fig.3. The architecture of the DeepMedic for automatic sphenoid
sinus
segmentation.
The
3D CNN has been adapted for five layers, with a receptive field of size 173
and 1 modality. The classification layer (the last layer) is implemented
like a convolutional layer with 13 kernels, which enables efficient
dense inference. When the network segments an input it predicts multiple voxels
simultaneously, one for each shift of its receptive field over the input (see
Figure 4). The training time required for convergence of the final system is
roughly 20 minutes using a CPU Intel I5-7300 with 2x2.5 GHz. Segmentation of a
3D scan of a sphenoid sinus requires 1 minute.
2.3 post-processing
The
segmentation result obtained by the 3D CNN of the precedent step method does
not make it possible to distinguish between the sphenoid sinus from the other
sinuses. The nasal cavities as well as the paranasal sinuses have almost the
same gray level intensity. To differentiate the sinuses, we have used a prior
knowledge about the positioning of these sinuses. Indeed, the sphenoid sinus is
the deepest cavity starting from the front face, and therefore it is the first
cavity encountered from the back of the skull at the median. Thus, using the
operations of mathematical morphology we have been able to locate the sphenoid
sinus. We have first applied an erosion operation to the segmented image, which
allows removing the residues, but especially the potential connections between
the sphenoid sinus and other cavities. More precisely, erosion operation allows
to remove the ostium and to well separate the two hemisinus of the sphenoid
sinus. Once the sphenoid sinus cleared, we have subsequently calculated the
centers of gravity of all the regions on the image. After sorting the centers
coordinates along the coronal axis, the deepest center corresponds, of course,
to the region of the sphenoid sinus, or more precisely corresponds to the
deepest hemisphere. When the hemisphere is segmented from the rest of the
cavities, a dilation operation (with the same parameters as the previews
erosion) is applied to recover some details of the shape lost during erosion
operation. As can be seen, the detection of the two hemispheres of the sinus is
sequential. Indeed, after removing the first
3.1
Dataset
The data set used includes 24 head CT volumes images, which
were taken on a CT scanner with several helical detectors. All CT scans with a
disease involving the sphenoid and its surroundings structures, but also with
mucosal thickening of the sinuses, mucosal sinus thickening or an anomaly in
the content of the sinuses were not included in the study. After the
preprocessing step, 3D CT-images less than 200 x 200 x 200 have obtained where
15 images were used to train the algorithm (training and validation) and 9
images to test the training. A manual segmentation of spheroid sinus for each
image on train data set was performed manually, so we did this assisted by a
radiologist.
3.2
Results
An example of 3 segmentations is reported in Figure 4.
It shows the result of the segmentation and the extracted sphenoid sinus as
explained in the previous sections. The segmentation is performed using the 3D
CNN and affine with the morphological operations.
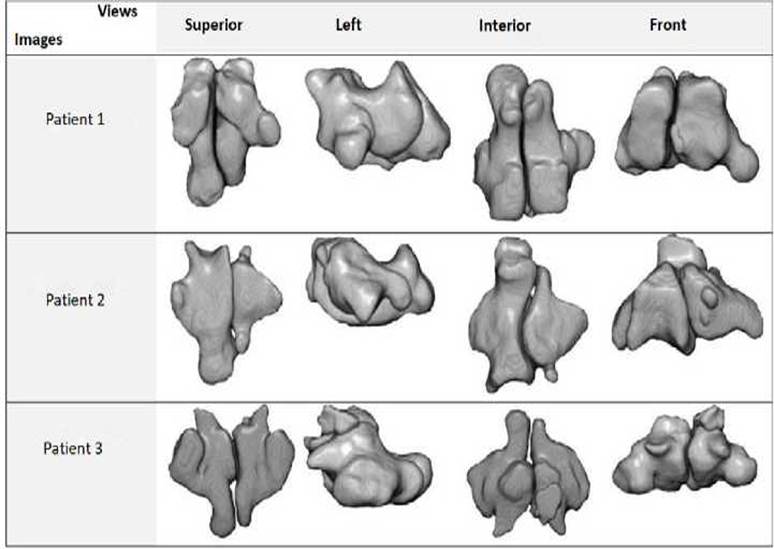
Fig.4. Segmentation examples for 3
CT-images, shows a superior, left, interior and front
views.
3.3
Validation
To evaluate the precision and reliability of our
automated approach, we have compared the results of segmentation of the same
sphenoidal sinus of our tool with the ITK-SNAP a semi-automatic segmentation
and with manual segmentation conducted with an experienced radiologist using a
standard procedure. Each image segmented by accurately drawing the contours of
the sphenoid sinus following the surface of the inner bone in an axial
direction. An example of the manual segmentation process of the spheroid sinus of
a slice is presented in Figure 5.
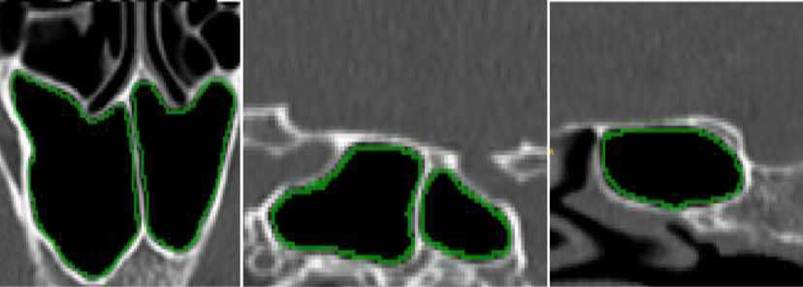
Fig. 5. Example of the process of
manual segmentation on one slice. From left to right: an axial,
sagittal and coronal view.
The DSC (Dice Similarity
Coefficient, HD (Hausdorff distance), and MAD (Mean Absolute Distance), were
used for evaluating the proposed method. The dice Coefficient (DSC), one of the
most commonly way for evaluating segmentation results, indicates a level of
similarity between the reference (manual segmentation) and segmented result
(automatic segmentation), the formulation of DSC is given by:
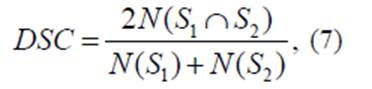
Where S1 and S2 represent the obtained segmentation and the
ground truth respectively (manual segmentation), and N
defines the number of pixels. DCS ∈ [0,1],
so that the closer DCS value to 1, is the better segmentation.
The HD is metric that represents the spatial
distance between two point sets, i.e., is the maximum distance between two
point sets C1 and C2,
from each point a ∈ C1
to point b ∈ C 2
and vice versa. HD is defined as follows:
![]()
The MAD metric is given
as follows:

![]()
where the distance between
the point ai, and the closest point, b j is given by
![]()
The three
obtained metrics DSC, HD, and MAD for all segmentations appear in Tables1 along
with a comparison between the proposed automatic segmentation and
semi-automatic clustering of ITK-SNAP for the nine CT- images respectively with
manual segmentation.
Table 1. Detailed results of comparison between the proposed
automatic and semi-automatic (ITK-SNAP) segmentation for 9 volumes, using
respectively DSC, HD, and MAD distances.

4.
Discussion
CT and Augmented Reality (AR) can improve the work of
otorhinolaryngologists because these tools help to investigate target and risk structures
[21]. AR can be smoothly incorporated into the operating workflow.
The sphenoid sinus segmentation is a specific
interesting problem and using Deep Learning (DL) to solve it is novel [22, 23,
24].
The methodology first cogitates ROI removal, followed
by the 3D CNN application and some preprocessing. The methodology employs a
standard 3D CNN previously used for medical image segmentation and analysis
called DeepMedic.
Using 3D CNNs help deal with handcrafting and
uncertainties but may pose problems related to Content-Based Image Retrieval
(CBIR) [23, 25]. There are already end-to-end DL solutions, e.g., V-net or
Seg-Net [26, 27] related to the segmentation. Later, the authors may compare
the proposed methods with other architectures as well as investigate the bias.
The chosen dataset is small since 15 annotated images have been used for
training and 9 images for testing. Hence, it is very uncertain whether better
conclusions can be made using other ampler datasets.
There is no evaluation of different CNN architectural
variants or different types of optimizers. To improve this scheme, the authors
should think about what the community can learn from the sphenoid sinus
segmentation problem such as
(i) what type of data are especially hard;
(ii) similarities between this problem and other
medical imaging segmentation applications;
(iii) if there is a novel solution for that
specific problem;
(iv) if this kind of networks can be trained
faster;
(v) if the design can be trained with the same
precision;
(vi) how to pick up the right amount of data; and
(vii) the model is trained in a very constrained
setting, where imagery containing fractures and so on has been removed; hence,
investigations on how to train the models with all the data instead of removing
the samples with fractures must be taken.
5. Conclusion
This
reading tackled studies dealing with automatic segmentation of the sphenoid
sinus via 3D CNN. The present study is the first initiative that found a decent
correlation between the manual and automated sphenoidal sinus volume estimation
techniques.
The
proposed automated extraction of the sphenoidal sinus volume based on CT exams
gives robust and accurate results close to the manual method where the reported
outcomes
6. Acknowledgments
The authors would like to
thank Rabeh Djabri.
7. Conflict of interest statement
The authors certify that
there is no conflict of interest with any financial organization in the subject
matter or materials discussed in this manuscript.
8. Authors’ biography
K.SOUADIH
received his Master degree in computer science from Abderrahmane MIRA
University, Bejaia, Algeria in 2015. Currently, his research interests include
images analysis and processing by using machine and deep learning techniques in
medical imaging.
A. Belaid
- Associate Professor at Abderrahmane MIRA University, Bejaia, Algeria and
Group Head of Image Processing at Medical Computing Laboratory (LIMED)
University of Abderrahmane MiraBejaïaAlgeria.
D. Ben
Salem, MD, PhD, is Professor of Radiology at the University of Western Brittany
(Brest, FR). He received his medical and doctoral degree from the University of
Burgundy (Dijon, FR). He is Editor-in-Chief of the Journal of Neuroradiology
and member of other editorials boards (Heliyon and the Journal of Forensic
Radiology and Imaging).
[1].
Giacomini, G. Pavan, A.L.M. Altemani, J.M.C.
Duarte, S.B. Fortaleza, C.M.C.B. Miranda, J.R. & Pina, D.R. (2018) Computed
tomography-based volumetric tool for standardized measurementofthemaxillarysinus,PLoSONE,13(1):e0190770.
doi:10.1371/journal.pone.0190770 https://doi.org/10.1371/journal.pone.0190770 SPMid:29304130 PMCid:PMC5755892
[2].
Knisely, A. Holmes, T. Barham, H. Sacks, R.& Harvey, R.(2016)
Isolated sphe¬noid sinus opacification: A systematic review American Journal of
Otolaryngology, Head and Neck Medicine and
Surgerhttps://doi.org/10.1016/j.amjoto.2017.01.014 PMid:28129912
[3].
Stokovic, N. Trkulja, V. Dumic-Cule, V. Cukovic-Bagic, I. T.L.S
Vukicevic, T.L.S. & Grgurevic, L. (2015) Sphenoid sinus types, dimensions
and relationship with surrounding structures Annals of Anatomy (2015), doi:
10.1016/j.aanat.2015.02.013 PMid:25843780
[4].
Burke M.C., Taheri, R, Bhojwani, R & Singh, A (2015) A
Practical Approach to the Imaging Interpretation of Sphenoid Sinus Pathology
Current Problems in Diagnostic,
http://dx.doi.org/10.10677j.cpradiol.2015.02.002
[5].
Hacl, A. Costa, A.L.F. Oliveira, J.M. Tucunduva, M.J. Girondi, J.R,
Raphaelli, A.C. & Scocate, N. (2016) Three-dimensional volumetric analysis
of frontal sinus using medical software.
Journal of Forensic Radiology and Imaging
https://doi.org/10.1016/j.jofri.2017.08.004
[6].
Wu, H.B. Zhu, L. Yuan, H.S. & Hou, C. (2011) Surgical
measurement to sphe¬noid sinus for the Chinese in Asia based on CT using
sagittal reconstruction images, Eur Arch Otorhinolaryngol (2011) 268 :2)1 2)6. https://doi.org/10.1007/s00405-010-1373-1 PMid:20857131
[7].
Guldnerc, C. Pistorius, S. Diogo, I. Bien, S. Sesterhenn, A.&
Werner, J. (2012) Analysis of pneumatization and neurovascular structures of
the sphenoid sinus using cone-beam tomography (cbt)Acta. Radiol., vol. 53, no.
2, pp. 214-9, 2012 https://doi.org/10.1258/ar.2011.110381
PMid:22383784
[8].
Auffret, M. Garetier, M. Diallo I. Aho, S. & Ben Salem, D.
(2016) Contribution of the computed tomography of the anatomical aspects of the
sphenoid sinuses to forensic identification J. Neuroradiol., vol. 43, no. 6,
pp. 404414, 2016 https://doi.org/10.1016/j.neurad.2016.03.007
PMid:27083691
[9].
Uthman, A.T. AL-Rawi,
N.H. Al-Naaimi,A.S. Tawfeeq
A.S. & Suhail
E.H. (2009)Evaluation of frontal sinus and skull measurements using
spiral CT scan¬ning: An aid in unknown person identification, Forensic Science
International 197 (2010) 124.e1 124.e7 https://doi.org/10.1016/j.forsciint.2009.12.064
PMid:20097024
[10].
Kawari, Y. Fukushima, K. Ogawa,T. Nishizaki,K. Gunduz,M. Fujimoto,
M.& Yu Masuda (1999)Volume Quantification of Healthy Paranasal Cavity by Three-Dimensional
CT Imaging Acta Otolaryngol (Stockh) 1999; Suppl 540: 45¬49
https://doi.org/10.1080/00016489950181198
[11].
Ahirwar, A. (2013) Study of Techniques used for Medical Image
Segmen¬tation and Computation of Statistical Test for Region Classification of
Brain MRII.J. Information Technology and Computer Science, 2013, 05, 44 53
https://doi.org/10.5815/ijitcs.2013.05.06
[12].
Shen, D. Wu, G. & Suk, H.(2017) Annu. Rev. Biomed. Eng. 2017.
19:22148 (The Annual Review of Biomedical Engineering is online at bioeng.annualreviews.org) https://doi.org/10.1146/annurev-bioeng-071516-044442
PMid:28301734 PMCid:PMC5479722
[13].
Srinivas, S. Sarvadevabhatla, R.K. Mopuri, K.R. Prabhu, N.
Kruthiventi, S.S.S. & Babu R.V. (2017) Introduction to Deep Convolutional
Neural Nets for Com¬puter Vision Deep Learning for Medical Image Analysis
-2017, Pages 25-52 https://doi.org/10.1016/B978-0-12-810408-8.00003-1
[14].
Kamnitsas, K. Ledig, C. Newcombe, V.F.J. Simpson, J.P. Kane, A.D.
Menon, D.K. Rueckert, D. & Glocker, B. (2015) Efficient multi-scale 3D CNN
with fully connected crf for accurate brain lesion segmentationproceeding of
ISLES challenge, MICCAI 2015
[15].
Jani, A. Savsani, V. & Pandya A. (2017) 3D Affine Registration
using Teaching Learning Based Optimization, 3D Research Center, Kwangwoon
Univer¬sity and Springer 2013https://doi.org/10.1007/3DRes.03(2013)2
[16].
Kamnitsas, K. Ferrante, E. Parisot, S. Ledig, C. Nori, A.
Criminisi, A Rueckert, D. & Glocker, B. (2016) DeepMedic for Brain Tumor
Segmentation Biomedical Image Analysis Group
https://doi.org/10.1007/978-3-319-55524-9_14
[17].
Simonyan, K. & Zisserman, A. (2014) Very deep convolutional
networks for large-scale image recognition, arXiv preprint arXiv:1409.1556
(2014)
[18].
Prionas, ND. Ray, S. & Boone, JM. (2011) Volume assessment
accuracy in computed tomography: a phantom study J Appl Clin Med Phys 2011;
11(2):3037. https://doi.org/10.1120/jacmp.v11i2.3037
PMCid:PMC5719953
[19].
Wafa, B., & A. Moussaoui. A review on methods to estimate a CT
from MRI data in the context of MRI-alone RT. Medical Technologies Journal,
Vol. 2, no. 1, Mar. 2018, pp. 150-178.
https://doi.org/10.26415/2572-004X-vol2iss1p150-178
[20].
Rachida, Z., A. Belaid, & Salem DB. A segmentation method of
skin MRI 3D high resolution in vivo. Medical Technologies Journal, Vol. 2, no.
3, Sept. 2018, pp. 255-61, https://doi.org/10.26415/2572-004X-vol2iss3p255-261
[21].
Carl B, Bop M, Voellger B, Saß B, Nimsky C (2019) Augmented reality
in transsphenoidal surgery, World Neurosurgery. doi:
10.1016/j.wneu.2019.01.202. https://doi.org/10.1016/j.wneu.2019.01.202
PMid:30763743
[22].
Razmjooy N, Estrela VV, Loschi H. J., Fanfan W. (2019) A comprehensive
survey of new meta-heuristic algorithms, Recent Advances in Hybrid
Metaheuristics for Data Clustering, Wiley Publishing.
[23].
Hemanth, D.H. & Estrela V.V. (2017) Deep Learning for Image
Processing Applications, IOS. ISBN: 978-1-61499-821-1 (print) | 978-1-61499-822-8
(online)
[24].
Razmjooy, N., & Estrela, V. V. (2019) Applications of Image
Processing and Soft Computing Systems in Agriculture (pp. 1-337). Hershey, PA:
IGI Global. doi:10.4018/978-1-5225-8027-0
https://doi.org/10.4018/978-1-5225-8027-0
[25].
Estrela, V. V., & Herrmann, A. E. (2016) Content-based image
retrieval (CBIR) in remote clinical diagnosis and healthcare. In M. Cruz-Cunha,
I. Miranda, R. Martinho, & R. Rijo (Eds.), Encyclopedia of E-Health and
Telemedicine (pp. 495-520). Hershey, PA: IGI https://doi.org/10.4018/978-1-4666-9978-6.ch039
[26].
Badrinarayanan, V., Kendall, A., & Cipolla, R. (2016) SegNet: A
deep convolutional encoder-decoder architecture for image segmentation. IEEE
Transactions on Pattern Analysis and Machine Intelligence, 39, 2481-2495. https://doi.org/10.1109/TPAMI.2016.2644615 PMid:28060704
[27].
Milletari, F., Navab, N., & Ahmadi, S. (2016) V-Net: Fully
convolutional neural networks for volumetric medical image segmentation. 2016 Fourth
International Conference on 3D Vision (3DV), 565-571.
https://doi.org/10.1109/3DV.2016.7