A New Approach for Breast Abnormality
Detection Based on Thermography
Type of article: Original article.
Nabil Karim Chebbah1, Mohamed Ouslim2, Ryad Temmar1
1.PhD
Student in Biomedical engineering and embedded system, LMSE laboratory,
Department of Electronics,Faculty
of Electrical Engineering, University of Science and Technology of Oran, Oran,
Algeria
2.
Professor, LMSE laboratory, Department of Electronics, Faculty of Electrical
Engineering, University of Science and Technology of Oran (USTO), Oran, Algeria
Abstract
Background:
Breast cancer is one of the most common women
cancers in the world. In this paper, a new method based on thermography for the
early detection of breast abnormality is proposed.
Methods: The
study involved 80 breast thermograms collected from
the PROENG public database which consist of 50 healthy breasts and 30 with some
findings. Image processing techniques
such as segmentation, texture analysis and mathematical morphology were used to
train a
support vector machine (SVM) classifier for automatic detection of breast abnormality.
Results: After conducting several tests, we obtained very
interesting and motivating results. Indeed, our classifier showed high
performance results giving an accuracy of 91.25%, a sensitivity and a
specificity of 93.3% and 90%, respectively.
Conclusion:
The final results let us conclude that infrared
thermography with the help of an adequate automatic classification algorithm
can be a valuable and reliable complementary tool for radiologists in detecting
breast cancer and thereby helping
to reduce mortality rates.
Keywords: Breast cancer, Thermography,
Image processing, Computer-Assisted Diagnosis
Corresponding author: Nabil Karim Chebbah, Biomedical engineering and
embedded system, LMSE laboratory, Department of Electronics,Faculty of Electrical Engineering,
University of Science and Technology of Oran, Oran, Algeria. Email: chebbah.nabilkarim@gmail.com
Received: June 30,
2018, Accepted: September 2, 2018, English editing: September 28, 2018,
Published: September 30, 2018.
Screened by iThenticate.©2017-2018 KNOWLEDGE
KINGDOM PUBLISHING.
1. Introduction
Nowadays,
breast cancer is the most common invasive cancer and the second leading cause
of cancer death for women worldwide. The WHO (World Health Organization) assess
that more than one million new cases are diagnosed each year and over 600 000
deaths are related to breast cancer across the world [1].
In Algeria, The Cancer
Registry of Set if in collaboration with the IARC (International Agency for
Research on Cancer) list breast cancer as the highest identified cancer cases
in Algeria, with more than11 000 new cases and 3000 deaths each year and its
incidence continues to increase by 7% a year, making it a major public health
problem [2].
The
improvement of advanced screening tools for the early breast cancer detection
becomes essential to reduce the mortality rate. Previous researchers showed
that there is an 85% chance of cure if the tumor is detected in a precocious
stage and only a 10% chance if detected later [3]. Hence, it is a very useful
task to provide diagnostic tools with high accuracy to help radiologists in
reducing false positive predictions.
Currently, there are several techniques to
detect and provide a diagnosis of breast abnormalities, such as echography, tomosynthesis, Magnetic Resonance Imaging (MRI), mammography,
Positron Emission Tomography (PET) and breast thermography. Each of them has
well known advantages and disadvantages. Mammography is the first line imaging technique
for breast cancer detection. It is a radiological screening modality that uses
an X-ray beam to detect anatomical changes in breast tissues. However, recent
research has suggested that mammography cannot be considered an ideal tool for
early diagnosis [3]. For example, the tumor must at least exceed a certain
thickness to be identified. Indeed, in [4], the authors reported that the size
of the tumor less than 1.66 cm was very difficult to detect by mammography. On
the other hand, this technique also exposes patients to X-rays that can damage
tissue and cause mutations [3].
Due
to the limitations of the current imaging techniques, researchers have given
special attention to thermography as a screening tool for breast cancer over
the last two decades due to the fact that this procedure is non-ionizing,
non-invasive and can detect breast abnormalities at an early stage. This technique
has been widely accepted as an auxiliary screening tool for breast cancer detection
to quantify risk and identify the population who will benefit from more
detailed oncological tests [5].
2. Previous related work
More than 2000
years ago, Hippocrates used the first thermo-biological application for a pathological
diagnosis. He applied mud all over a patient’s body and then he noticed that
the mud dried quicker in some places, which helped him identify the unhealthy
areas [6]. Since then, many studies have focused onthermo-biology
realizing that cancerous area in the mammary organ produces a significantly
higher temperature than healthy breasts. This is because these lesions (or
tumors) contain more veins and have a higher metabolic rate than the
surrounding tissues [7]. In the research conducted by Professor Gautherie, at the laboratory of biomedical thermology at Louis Pasteur University [8], 784 subjects
with initially normal breasts (with no mammographics
or echographics findings) and anomalous thermograms were carefully attended during a period of twelve-year.
Subsequently,
238 patients developed cancer along the4 years that
followed, which represents 38% of the patients who were
initially diagnosed as abnormal by thermography and normal by mammography. Therefore, researchers stated that IR thermography could
predict the development of breast cancer quite effectively.
More details on
the thermography mechanism, the protocol acquisition, and patient characteristic
are found in [6, 9 and 10].
Although
thermography is a promising screening tool for breast cancer, a robust and
efficient computer-aided diagnosis (CAD) system must be developed to overcome
factors such as scarcity of qualified personnel and limitation of the human
visual system to differentiate the minimal temperature differences produced by
thermographic imaging. Several researchers have worked on developing CAD systems for breast
cancer detection based on advances in digital image processing and data mining.
Sheeja et al. suggest the use of curvelet based
feature extraction in order to classify breast thermograms
as normal or abnormal; the proposed approach showed 90.91% accuracy, 81.82% and
100% of sensitivity and specificity, respectively [4]. Rajendra et al. extracted
texture features using structural and statistical approach with a support
vector machine (SVM) classifier to automatically detect signs of breast cancer;
50 thermographic images were used (25 normal and 25 cancerous);88.10% of sensitivity,
85.71% of specificity and 90.48% of accuracy were obtained [11].Schaefer
et al. performed a fuzzy-logic based classifier coupled with a variety of
statistical features based on the asymmetry analysis of the breast and providing
a classification accuracy of 80%[12]. Pramanik et al.
presented an automatic diagnosis system based on discrete wavelet transform to
detect early breast cancer in a thermogram; the Otsu
threshold and morphological operation-based segmentation were applied to define
the ROI; then, statistical and texture features were extracted and used to
train an artificial neural network classifier providing an accuracy of 90.48%[13].Acharya
et al. investigated the conversion of the 2D thermograms
into a one-dimensional data using a radon transform; high order spectral
features were extracted from the transformed data in order to analyze the asymmetry
between the two breasts; the methodology obtained 80% accuracy, 76% and 84%
sensitivity and specificity, respectively using the SVM classifier. However, in
[14] artificial neural network classifier gave better performance values with 92%
of sensitivity, 88% of specificity, and 90% of accuracy. Ming et al. [15] developed
a CAD system based on feature extraction and decision tree classifier for the
automatic detection of breast cancer. Tuan et al. investigated the usage of
complementary learning fuzzy neural networks for breast cancer classification;
the authors achieved an accuracy of 86.6% [16]. Gerald. S presented an approach
of analyzing breast thermograms that used features
extraction and ant colony optimization (ACO) based pattern recognition for the
classification of normal and abnormal breast thermogram;
experimental results gave an accuracy of 79.52% [17]. Kandlikar
et al. reviewed the advances over the last three decades in the use of thermal
imaging to detect breast cancer [7].
3. The proposed work
In this study, we
propose a new approach for a computer aided diagnosis system based on breast
thermography to decrease the operator dependence and to assist radiologists in
the precocious breast cancer detection. Figure 2 illustrates the process plan
of the main operations involved in the proposed technique.

After the image
acquisition, we converted the breast thermograms from
color to gray scale image, then the regions of interest (ROIs) were segmented,
which involve the separation areas of the image that represent the breast from
the background and isolate the left and right breasts; then, a GLCM (Gray level
co-occurrence matrix) and morphological operations were used on the segmented
image to extract statistical and textural features. Finally, a supervised
learning technique, namely SVM (Support Vector Machine) was performed to
classify breasts as normal or abnormal. The remainder part of this paper explains in more
details all the steps involved within the proposed technique.
3.1 Data
acquisition
In this study, a total of 80 frontal breast thermograms 50 normal and 30 abnormal were collected from
an open source online database [18]. Infrared thermograms
were acquired at the Fluminense Federal University
(UFF) using a FLIR Therma Cam SC620 infrared camera
with a spectral bandwidth of 7.5–13μm (30 frames/s), a thermal resolution of
40mK at 30°C and an image resolution of 640x480 pixels. All the patients with
abnormal breast were previously diagnosed through biopsies and their thermography
report was confirmed by a skilled specialist [18].
3.2 Preprocessing and segmentation
The first stage of the CAD system is preprocessing.
This includes image resizing and converting the RGB color input image into
intensity gray scale in which white pixels will represent the highest
temperatures and black, the lowest ones. This step of image processing is used
to enhance the quality of the thermographic images and make the classification
and features extraction phases more efficient.
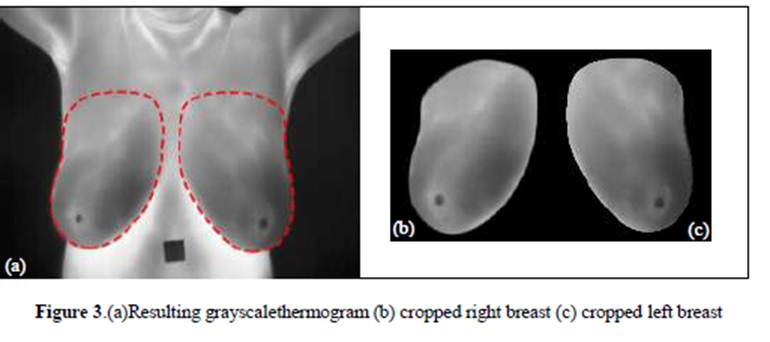
In the segmentation stage, unnecessary details that
may lead to wrong diagnosis such as neck, inframammary folds and background
have been removed and the region of interest has been separated into right and left
breast. The classification performance results depend greatly on the proper delineating
of the two breasts. For this purpose, segmentation was carried out manually in
this work with medical expert’s assistance to obtain the most exact delineating
of the right and left breast due to absence of definite shape and clear edges
of the breast in thermal images [19]. Various segmentation algorithms have been
proposed to delineate the breast automatically or semi-automatically, but with
moderate success rates [20-23]. Figure 3 shows the resulting right and left
breast thermogram after preprocessing and
segmentation phases.
3.3Features extraction
This step of CAD system represents an
important image processing task by which certain characteristics of interest in
an image are converted from a graphical representation (data in pixels) to a
quantitative representation (data in vector).
In this third phase of CAD system, features
are extracted using texture analysis, which represent the thermal variations of
the breast quite effectively. Several methods have been proposed to measure
texture properties of an image [24], one of these methods is the GLCM (Gray Level
Co-occurrence Matrix)which describes the texture of an image by calculating how
frequently combinations of pixels with a definite value of gray
intensity and in a specific dimension occur in an image[24].In this work we
computed and normalized GLCM of the ROI, a series of second order statistical
texture parameters proposed by Haralick [25]are then
extracted from this matrix. Besides, some first and high order statistical
measures calculated from the original image values were added with the previous
features in order to improve the classification accuracy.
3.4Classification
Feature vectors extracted from segmented breast thermograms are used to form an SVM classifier that proved
good performance for the automatic detection of cancerous breast. Several supervised
learning methods have been reported in the literature for breast cancer
detection based on thermography such as: Artificial Neural Network [13], K-nearest
neighbors [26], fuzzy logic-based classifier [12] and Support Vector Machine
(SVM) [11]. The latter is the most powerful and it is widely used in the
classification of health diseases, especially in oncology, due to its high
accuracy and its ability to deal with high-dimensional data.
4. Results and comments
We conducted several tests by applying the
proposed method on the large dataset of 80 breast thermograms.
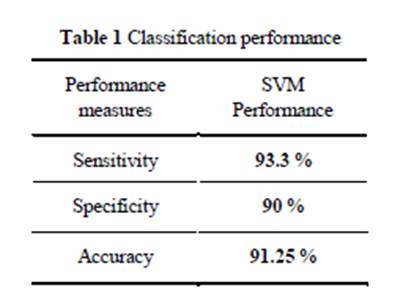
In order to measure the method’s performance, we selected three metrics: the sensitivity, the specificity and the accuracy.
![]() Sensitivity
is the possibility that a test used in a sick patient will produce a positive result. It is given by the equation (1).
Sensitivity
is the possibility that a test used in a sick patient will produce a positive result. It is given by the equation (1).
![]()
![]() Specificity is the possibility that a test used in a
healthy patient will produce a negative result. The formula
for finding specificity is given in the equation (2).
Specificity is the possibility that a test used in a
healthy patient will produce a negative result. The formula
for finding specificity is given in the equation (2).
![]()
Accuracy is defined as the number of correct predictions from all
predictions made. It is given by the equation (3).
![]()
The obtained experimental results are summarized in Table 1 where we can
clearly see the excellent classification performance of the proposed method.
We also present
in Table 2 the confusion matrix, for further inspection of the testing
approach.
All the tests were carried
out on Intel core i7-5500U 2.4GHz processor with 8GB RAM, running under Windows
7 64-bits operating system. The averaged computation time for a 200x200 size
image was around 0.14 seconds. The algorithm and a graphical user interface
shown in Figure 4 were developed via Matlab 2016.
Figure 4. Menu driven interface of the presented CAD
system
Different functionalities have been introduced to facilitate the use of
this graphical interface. The Open Image button is used to load the breast
thermography as well as the corresponding segmented region of interest. The
Image information panel shows details of the input thermogram,
such as width, height and image type. The software also displays the histogram
of the segmented ROI. In the other hand, by clicking on the SVM classification
button, the feature extraction operation is automatically done followed by their
feeding in the support vector machine classifier. Finally, the system returns
the result of the classification that is displayed in the results section. In
the figure above, the result shows that the input segmented thermogram
corresponds to an unhealthy breast class.
5. Conclusion and Further
development
The present paper suggests an automatic computer assisted diagnostic
approach for the precocious breast cancer detection based on medical thermal
imaging. The region of interest has been converted to grayscale and separated
from the background and extra region. Subsequently, both textural and
statistical features were extracted to feed a supervised learning machine for
the classification of unhealthy and normal breast thermograms.
Experimental results affirm the effectiveness of the method, giving a 93.3% of
sensitivity, 90% of specificity and 91.25% of accuracy. We conclude that breast thermography
is a good screening modality for the early detection of breast cancer and
should be implemented as a complementary test in our country. As
a continuation to the work, we propose the implementation of this method on an
embedded system to take advantage of the parallelism available in some
architectures in order to improve the system performances and reduce the
computation time.
6. Acknowledgement
Authors
thank Dr F Senouci from
Oran Healthcare Center, Algeria, for the assistance in the segmentation of the
regions of interest.
7. Conflict of intereststatement
We certify that there is no conflict of interest with
any financial organization in the subject matter or materials discussed in this
manuscript.
8. Authors’ biography
No Biography
9. Reference
[1] Ibrahim, Abdelhameed, Shaimaa Mohammed, and Hesham
Arafat Ali. "Breast Cancer Detection and Classification Using
Thermography: A Review." International Conference on Advanced Machine
Learning Technologies and Applications. Springer, Cham, (2018).
https://doi.org/10.1007/978-3-319-74690-6_49
[2] Hamdi-Cherif, M., et al.
"Cancer estimation
of incidence and survival in Algeria 2014." J Cancer Res Ther 3.9 (2015): 100-104.
https://doi.org/10.14312/2052-4994.2015-14
[3] Lanisa, Norlailah, Ng Siew Cheok, and Lai
Khin Wee. "Color morphology and segmentation of
the breast thermography image." Biomedical Engineering and Sciences
(IECBES), 2014 IEEE Conference on. IEEE, (2014).
[4] Francis, Sheeja V., M. Sasikala, and S. Saranya.
"Detection of breast abnormality from thermograms
using curvelet transform based feature
extraction." Journal of medical systems 38.4 (2014): 23.
[5] Lahiri, B. B., et al. "Medical
applications of infrared thermography: a review." Infrared Physics &
Technology 55.4 (2012): 221-235.
https://doi.org/10.1016/j.infrared.2012.03.007
[6] Etehadtavakol, Mahnaz, and Eddie YK Ng. "An Overview of Medical
Infrared Imaging in Breast Abnormalities Detection." Application of
Infrared to Biomedical Sciences. Springer, Singapore, (2017). 45-57.
[7] Yaneli, Ameca-Alducin Maria, et al. "Assessment of bayesian network classifiers as tools for discriminating
breast cancer pre-diagnosis based on three diagnostic methods." Mexican
International Conference on Artificial Intelligence. Springer, Berlin,
Heidelberg, (2012).
[8] Gautherie, Michel, and
Charles M. Gros. "Breast thermography and cancer
risk prediction." Cancer 45.1 (1980): 51-56.
https://doi.org/10.1002/1097-0142(19800101)45:1<51::AID-CNCR2820450110>3.0.CO;2-L
https://doi.org/10.1002/cncr.2820450110
PMid:7351006
[9] Kandlikar, Satish G., et
al. "Infrared imaging technology for breast cancer detection–Current
status, protocols and new directions." International Journal of Heat and
Mass Transfer 108. USA (2017): 2303-2320.
[10] Vardasca, Ricardo,
Lucia Vaz, and Joaquim Mendes. "Classification
and Decision Making of Medical Infrared Thermal Images." Classification in
BioApps. Springer, Cham, (2018). 79-104.
[11] Acharya, U. Rajendra,
et al. "Thermography based breast cancer detection using texture features
and support vector machine." Journal of medical systems 36.3 (2012):
1503-1510.
https://doi.org/10.1007/s10916-010-9611-z
PMid:20957511
[12] Schaefer, Gerald, Michal Závišek,
and Tomoharu Nakashima. "Thermography based
breast cancer analysis using statistical features and fuzzy
classification." Pattern Recognition 42.6 (2009): 1133-1137.
https://doi.org/10.1016/j.patcog.2008.08.007
[13] Pramanik, Sourav, Debotosh Bhattacharjee, and MitaNasipuri.
"Wavelet based thermogram analysis for breast
cancer detection." Advanced Computing and Communication (ISACC), 2015
International Symposium on. IEEE, (2015).
[14] Acharya, U. Rajendra,
et al. "Higher order spectra analysis of breast thermograms
for the automated identification of breast cancer." Expert Systems 31.1
(2014): 37-47.
https://doi.org/10.1111/j.1468-0394.2012.00654.x
[15] Lee, Ming-Yih, and
Chi-Shih Yang. "Entropy-based feature extraction and decision tree
induction for breast cancer diagnosis with standardized thermograph
images." Computer methods and programs in biomedicine 100.3 (2010): 269-282.
https://doi.org/10.1016/j.cmpb.2010.04.014
PMid:20537756
[16] Tan, Tuan
Zea, et al. "A novel cognitive interpretation of breast cancer thermography with
complementary learning fuzzy neural memory structure." Expert Systems with
Applications 33.3 (2007): 652-666.
https://doi.org/10.1016/j.eswa.2006.06.012
[17] Gerald, S. "ACO classification of thermogram symmetry features for breast cancer
diagnosis". Memetic Computing, (2014). 6(3): p. 207-212. Springer
https://doi.org/10.1007/s12293-014-0135-9
[18] Silva, L. F., et al. "A new database for breast
research with infrared image." Journal of Medical Imaging and Health
Informatics 4.1 (2014): 92-100.
https://doi.org/10.1166/jmihi.2014.1226
[19] Borchartt, Tiago B., et al. "Breast thermography from an image processing
viewpoint: A survey." Signal Processing 93.10 (2013): 2785-2803.
https://doi.org/10.1016/j.sigpro.2012.08.012
[20] Suganthi, S. S., and S.
Ramakrishnan. "Semi automatic
segmentation of breast thermograms using variational level set method." The 15th International
Conference on Biomedical Engineering. Springer, Cham, (2014).
[21] Golestani, N., M. EtehadTavakol, and E. Y. K. Ng. "Level set method for
segmentation of infrared breast thermograms."
EXCLI journal 13 (2014): 241.
PMid:26417258 PMCid:PMC4464455
[22] Srinivasan, Suganthi
Salem, and Ramakrishnan Swaminathan.
"Segmentation of breast tissues in infrared images using modified phase
based level sets." Biomedical Informatics and Technology. Springer,
Berlin, Heidelberg, (2014). 161-174.
[23] De Oliveira, J. P. S., et al. "Segmentation
of infrared images: A new technology for early detection of breast
diseases." Industrial Technology (ICIT), 2015 IEEE International
Conference on. IEEE, (2015).
[24] Shang, Zhigang, and Mengmeng Li. "Combined feature extraction and
selection in texture analysis." Computational Intelligence and Design
(ISCID), 2016 9th International Symposium on. Vol. 1. IEEE, (2016).
[25] Haralick, Robert M.,
and Karthikeyan Shanmugam.
"Textural features for image classification." IEEE Transactions on
systems, man, and cybernetics 6 (1973): 610-621.
https://doi.org/10.1109/TSMC.1973.4309314
[26] Milosevic, Marina, Dragan Jankovic,
and Aleksandar Peulic.
"Thermography based breast cancer detection using texture features and
minimum variance quantization." EXCLI journal 13 (2014): 1204.
PMid:26417334 PMCid:PMC4464488
[27] Rassiwala, Muffazzal,
et al. "Evaluation of digital infra–red thermal imaging as an adjunctive
screening method for breast carcinoma: A pilot study." International
Journal of Surgery 12.12 (2014): 1439-1443.
https://doi.org/10.1016/j.ijsu.2014.10.010
PMid:25448668